
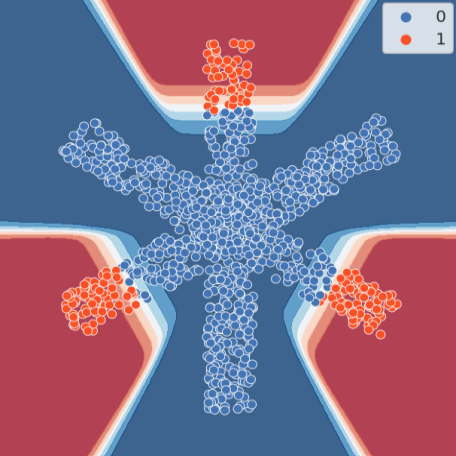
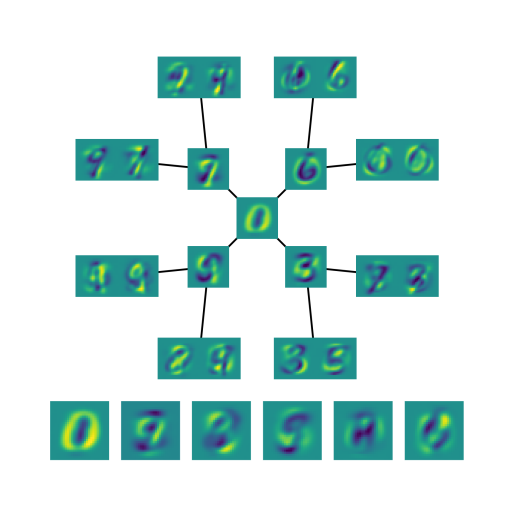
We propose an ensemble approach to classification with missing values in machine learning. The proposed approach does not rely on imputing missing values before performing inference on the filled dataset, but instead uses a novel subspace clustering algorithm to characterize an input space as a hierarchy of localized affine subspaces, each of which produces a low-dimensional embedding of samples with missing data. The experts are trained on the associated embeddings, and final predictions are a weighted sum of all expert predictions. The proposed method achieves state-of-the-art performance in experiments conducted on various reference datasets.
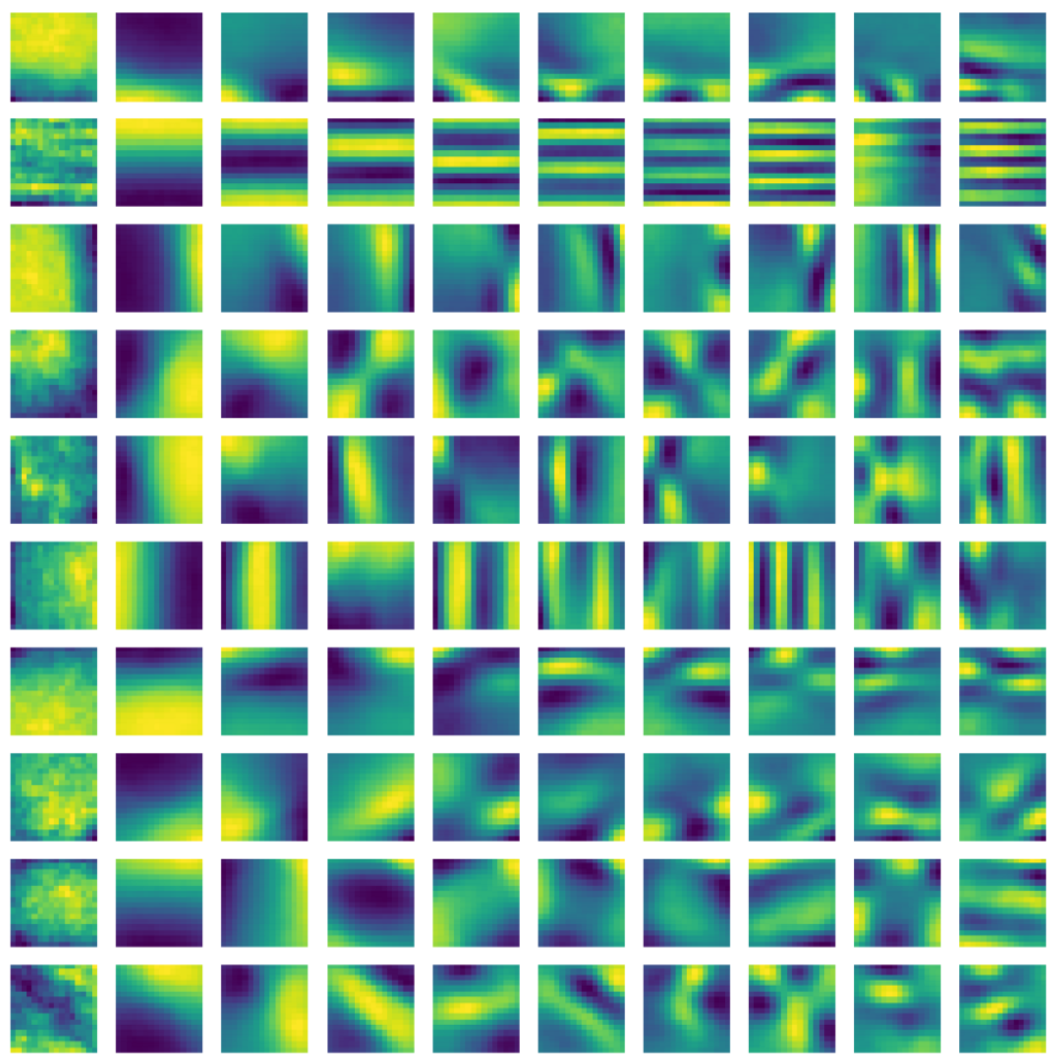
We present a technique to accelerate the training of convolutional neural networks (CNNs) by cheaply introducing constrained supervision into layer-by-layer unsupervised initialization techniques. The proposed method uses a meta model to learn a linear transformation of filters initialized using a feature extraction technique, which is trained on a drastically downsized version of a layer's feature maps to enable fast learning. The method demonstrates large improvements in initialization performance, consistent across reference image classification datasets and feature extraction techniques. The proposed approach enables acceptable classification performance with only training the head of CNNs after initializing filters, enabling an order of magnitude faster training than the traditional approach.
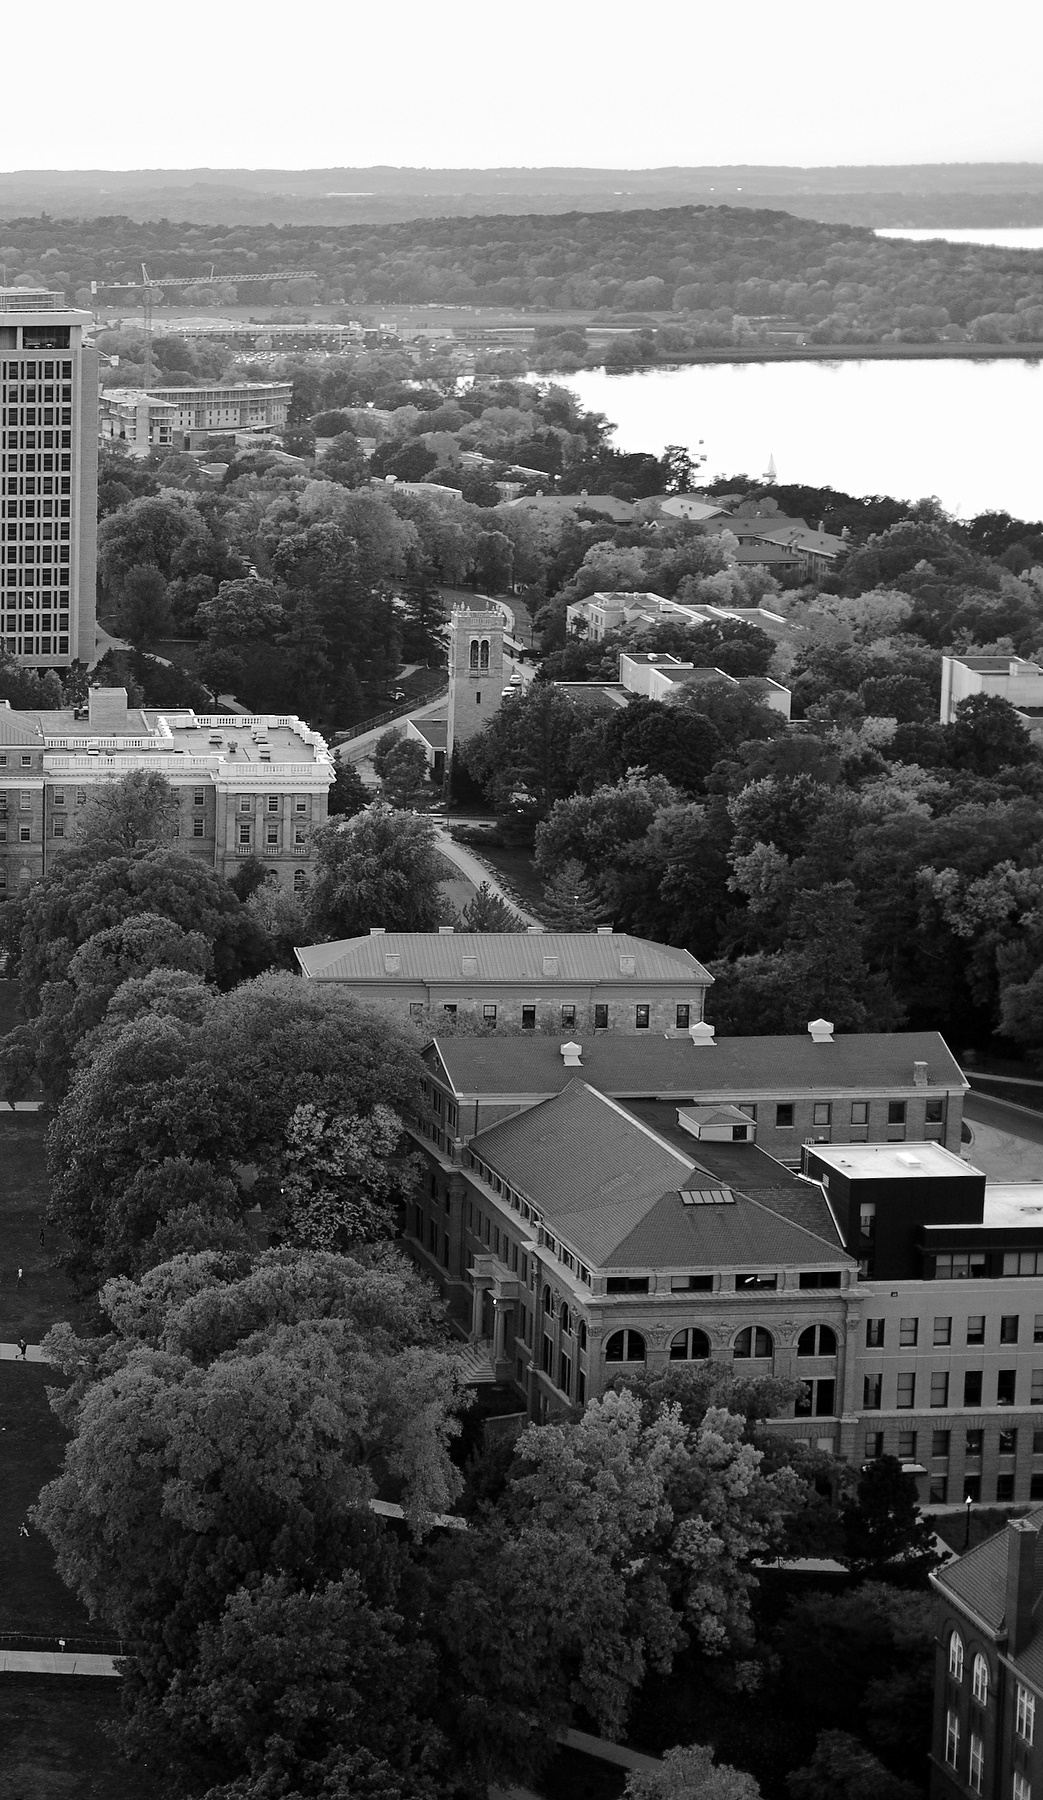
A collection of artistic works of static and interactive generative graphic design.


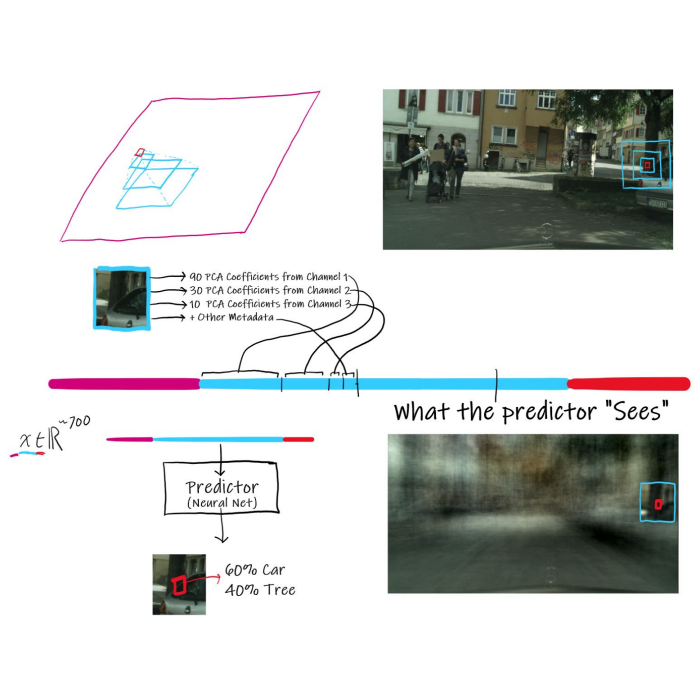
An exploration of a novel alternative to traditional CNN-based semantic segmentation as applied to self-driving cars with the CityScapes dataset.
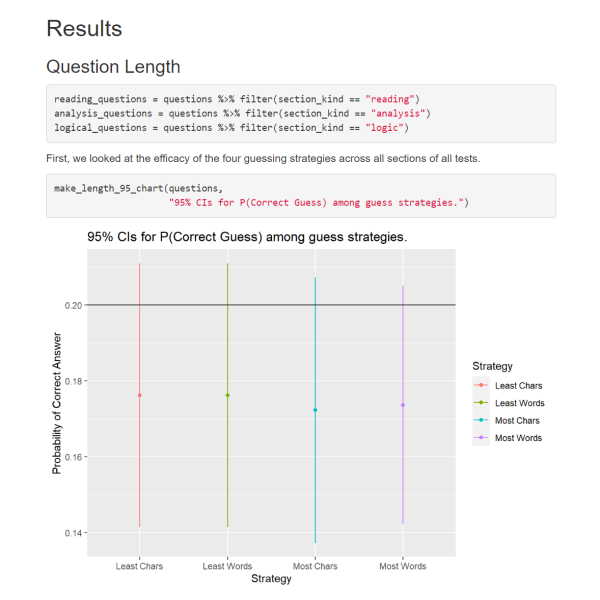
An analysis of past LSAT exams to determine the validity of popular strategies for guessing the correct multiple choice answer based on answer metadata like letter (A-E), length in words, and previous answer letter.
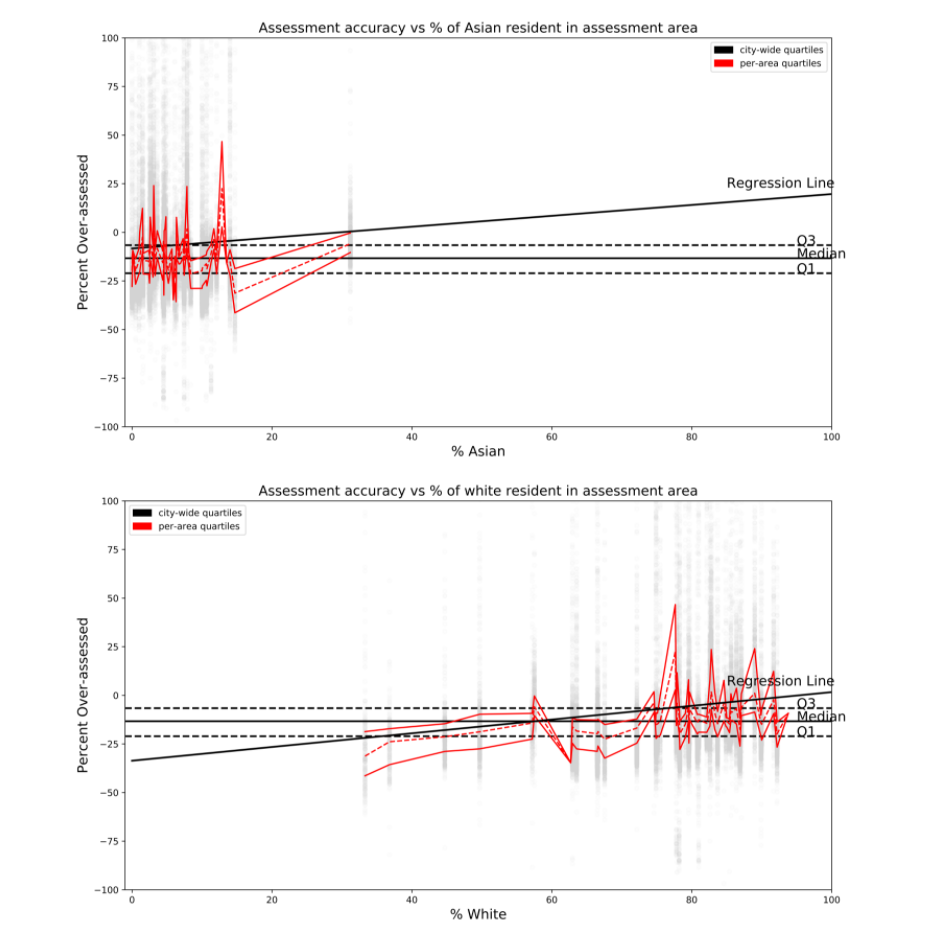
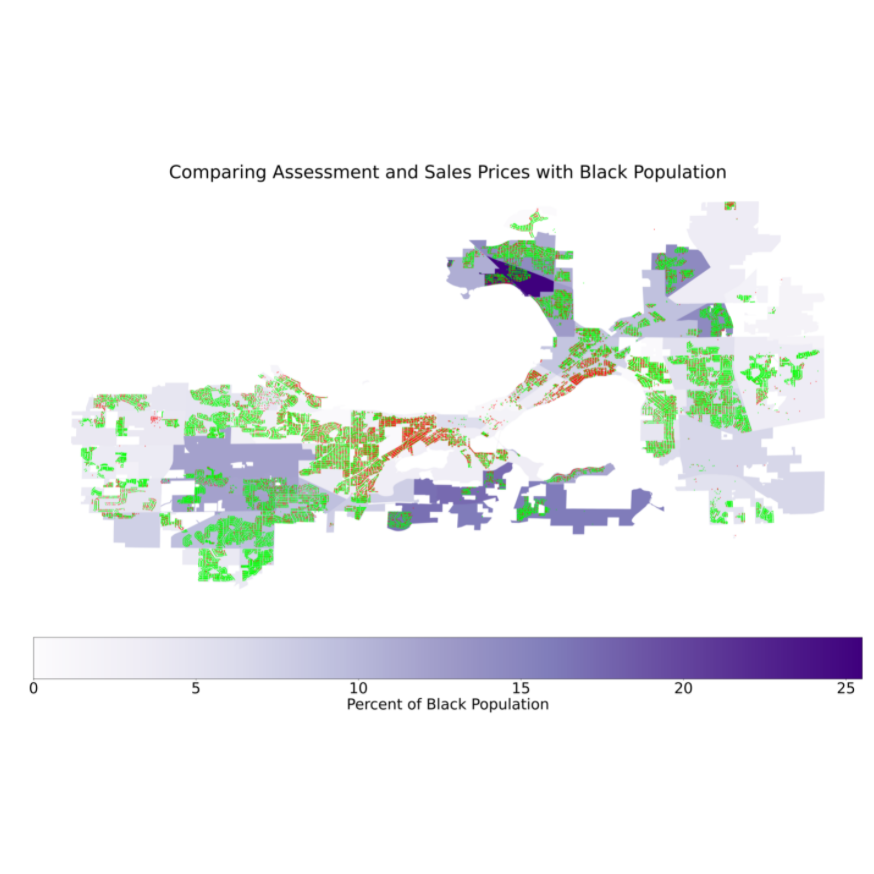
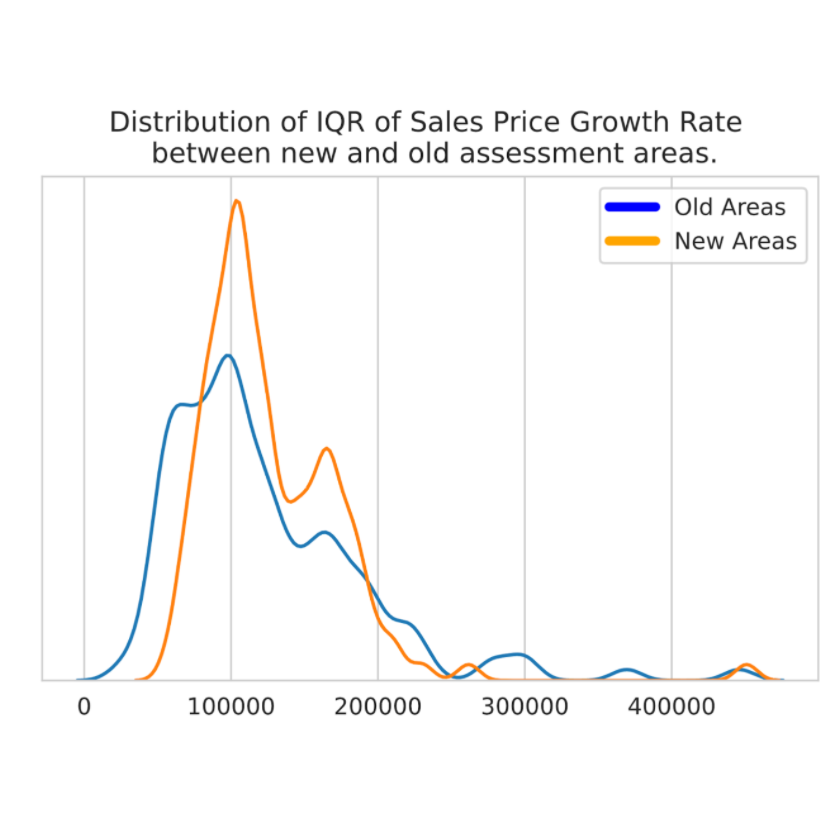
A project completed in partnership with the City of Madison to investigate the fairness of tax-assessed home values with respect to racial demographics.
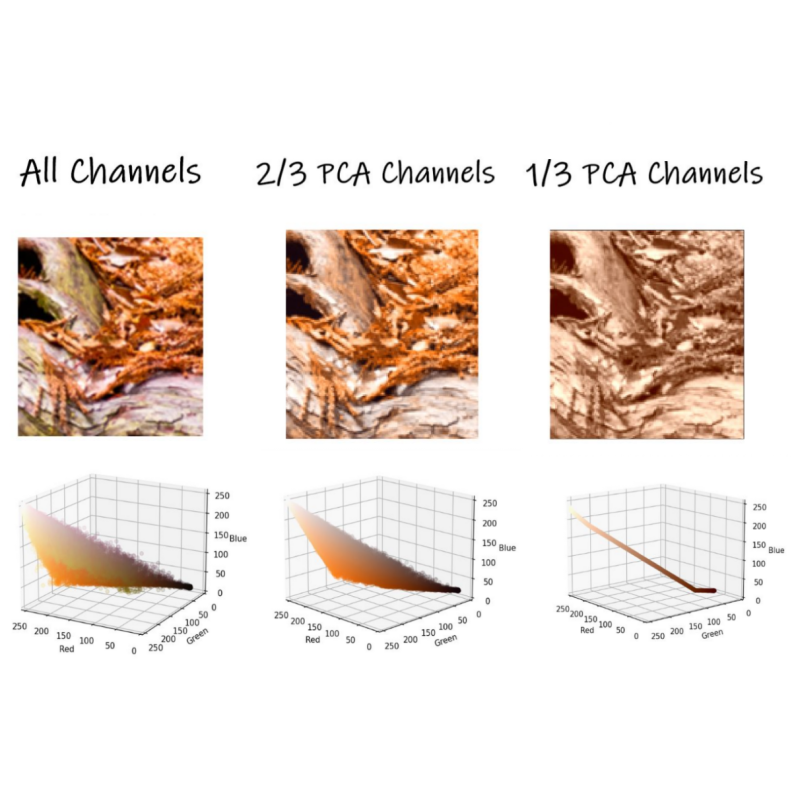
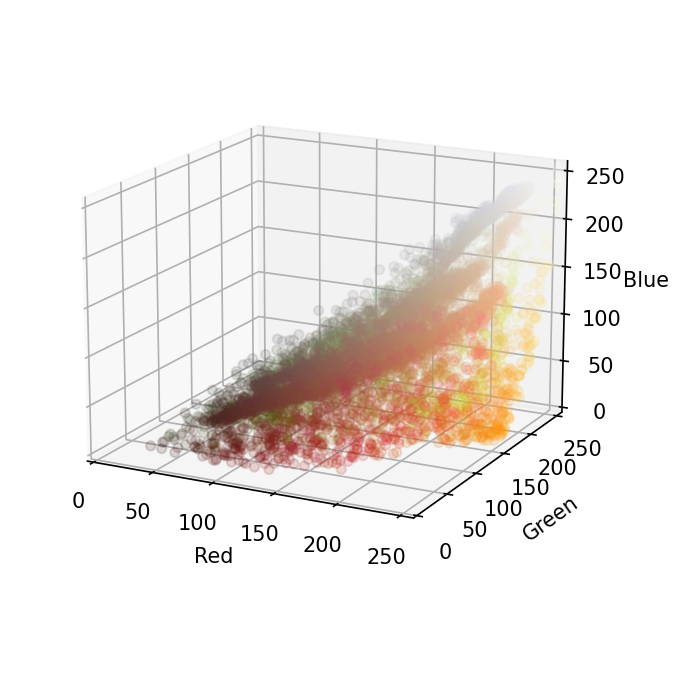
A new image compression format that uses both unsupervised and supervised machine learning techniques to (hopefully) outperform existing methods of image compression.

A showcase of metrics tracking Milwaukee's status as a Tech Hub.


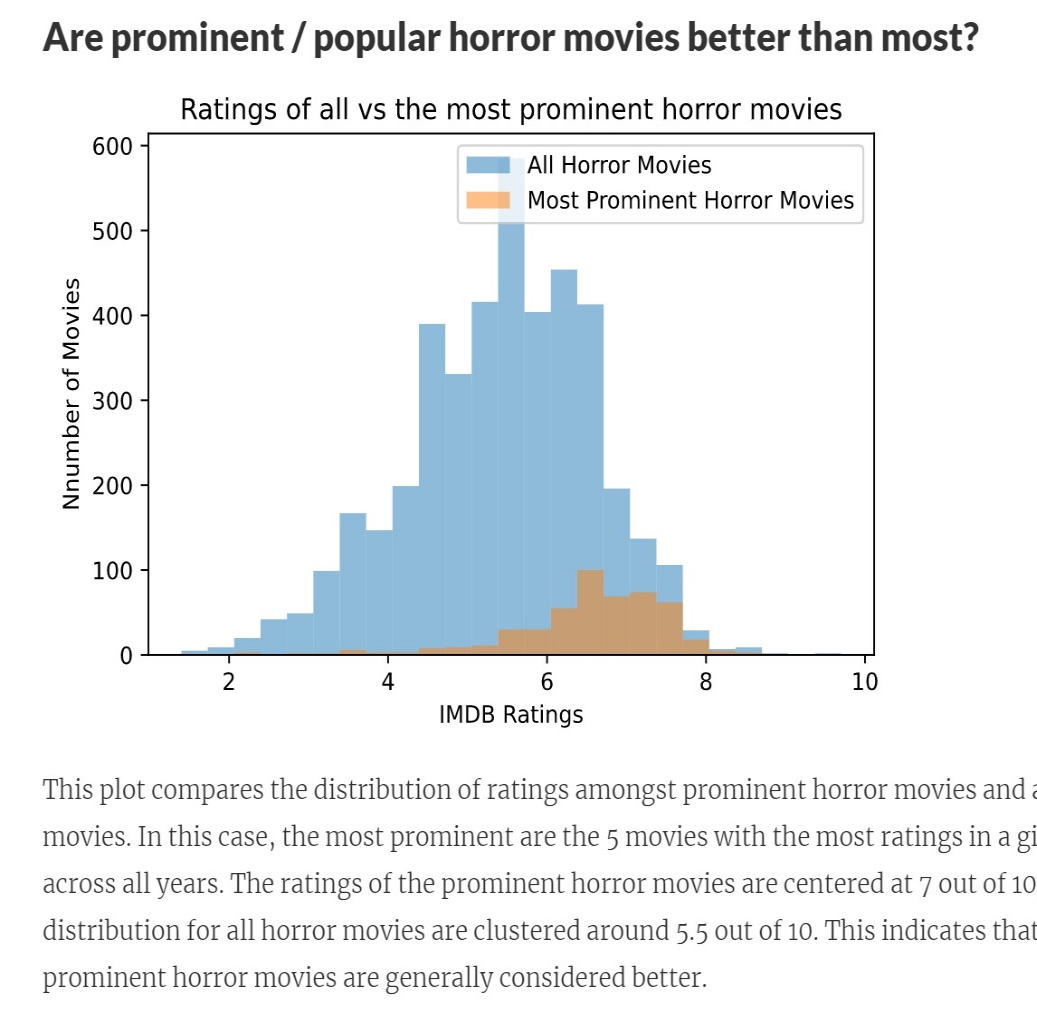
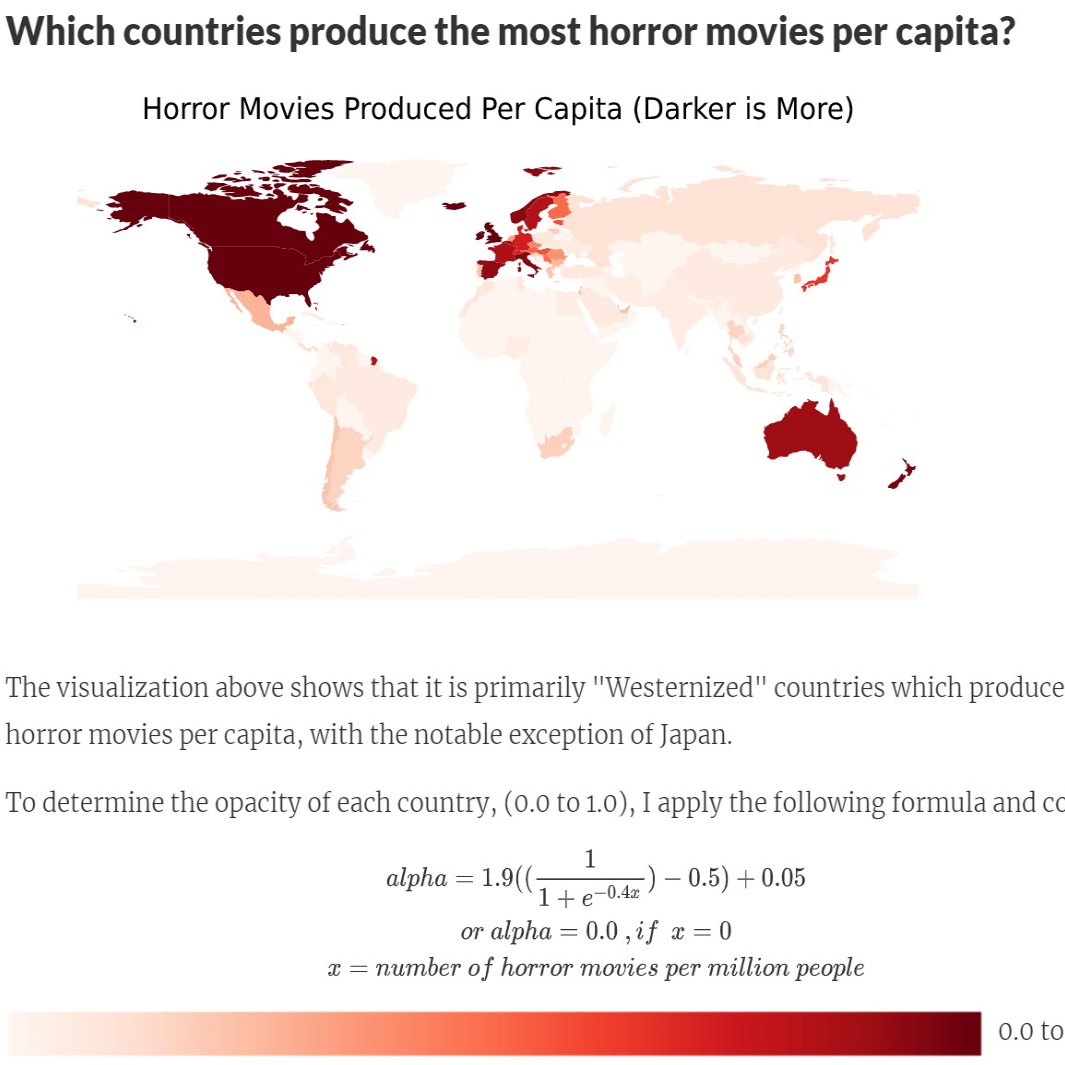
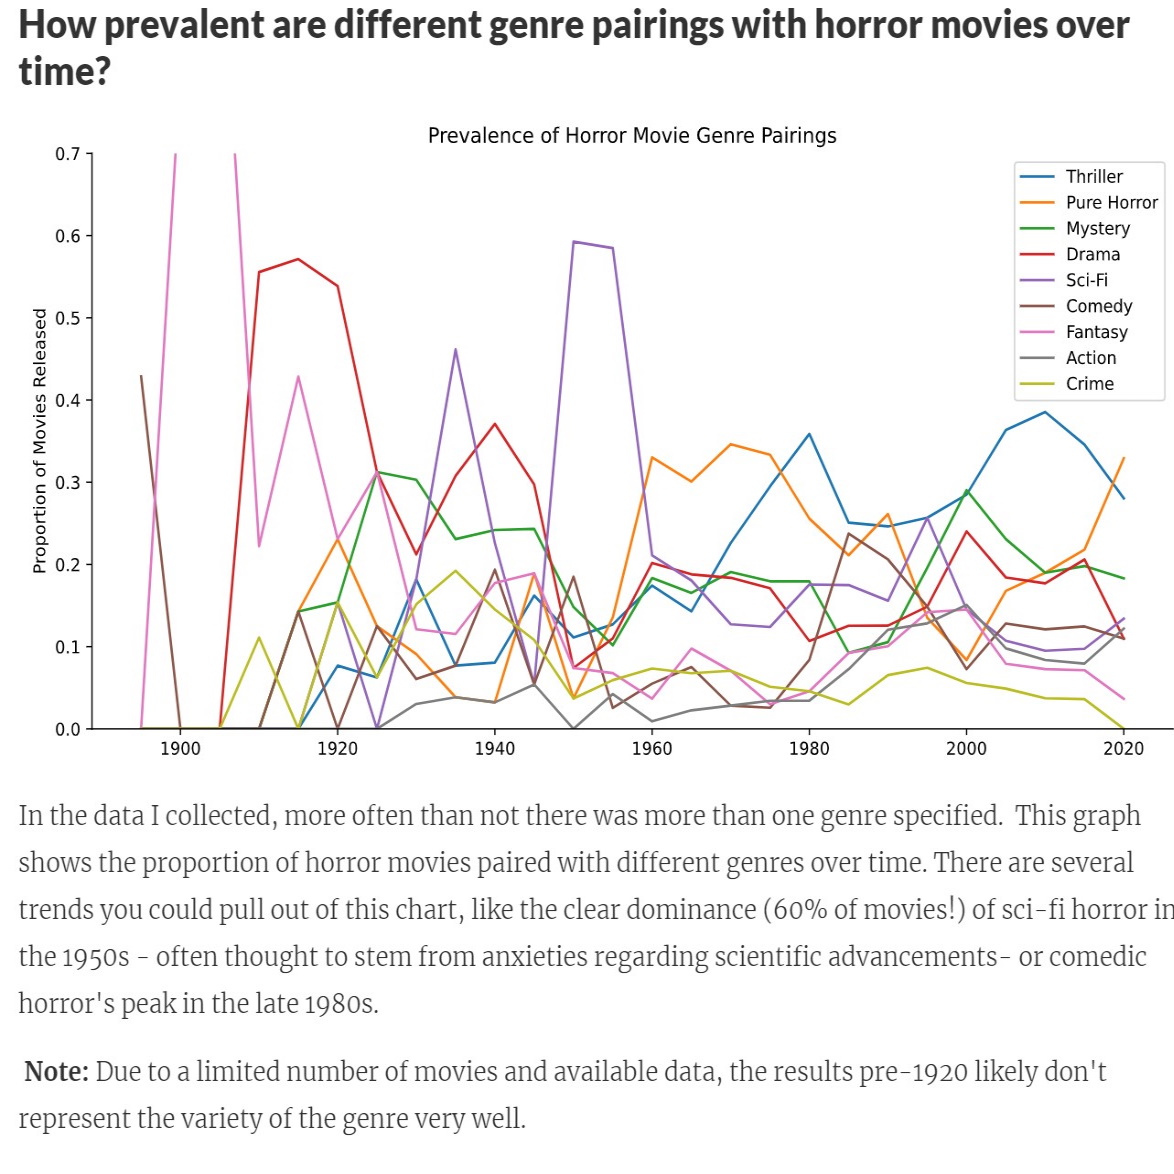
My final project for an introductory Data Science class, an analysis of Horror Movie data
A full-stack NodeJS web app with basic social media functionality


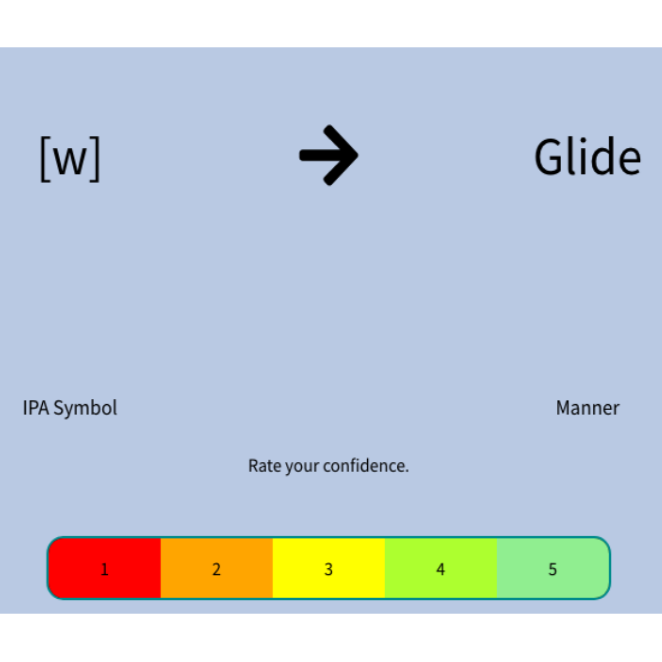
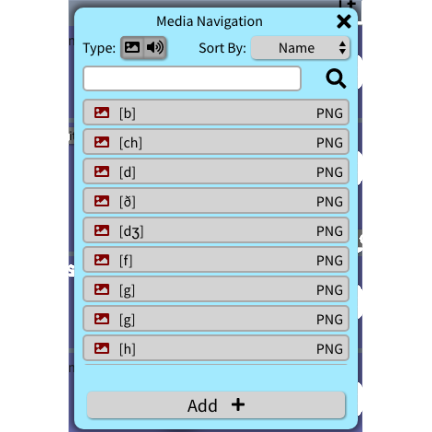
A Prototype of an advanced study tool for the 2019 innovation competition Transcend Madison


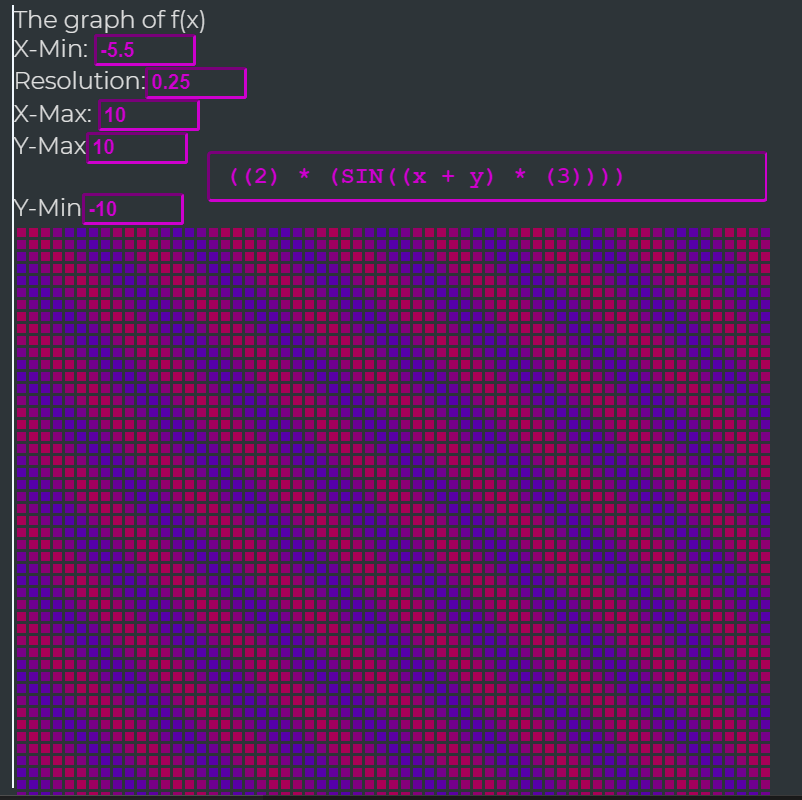
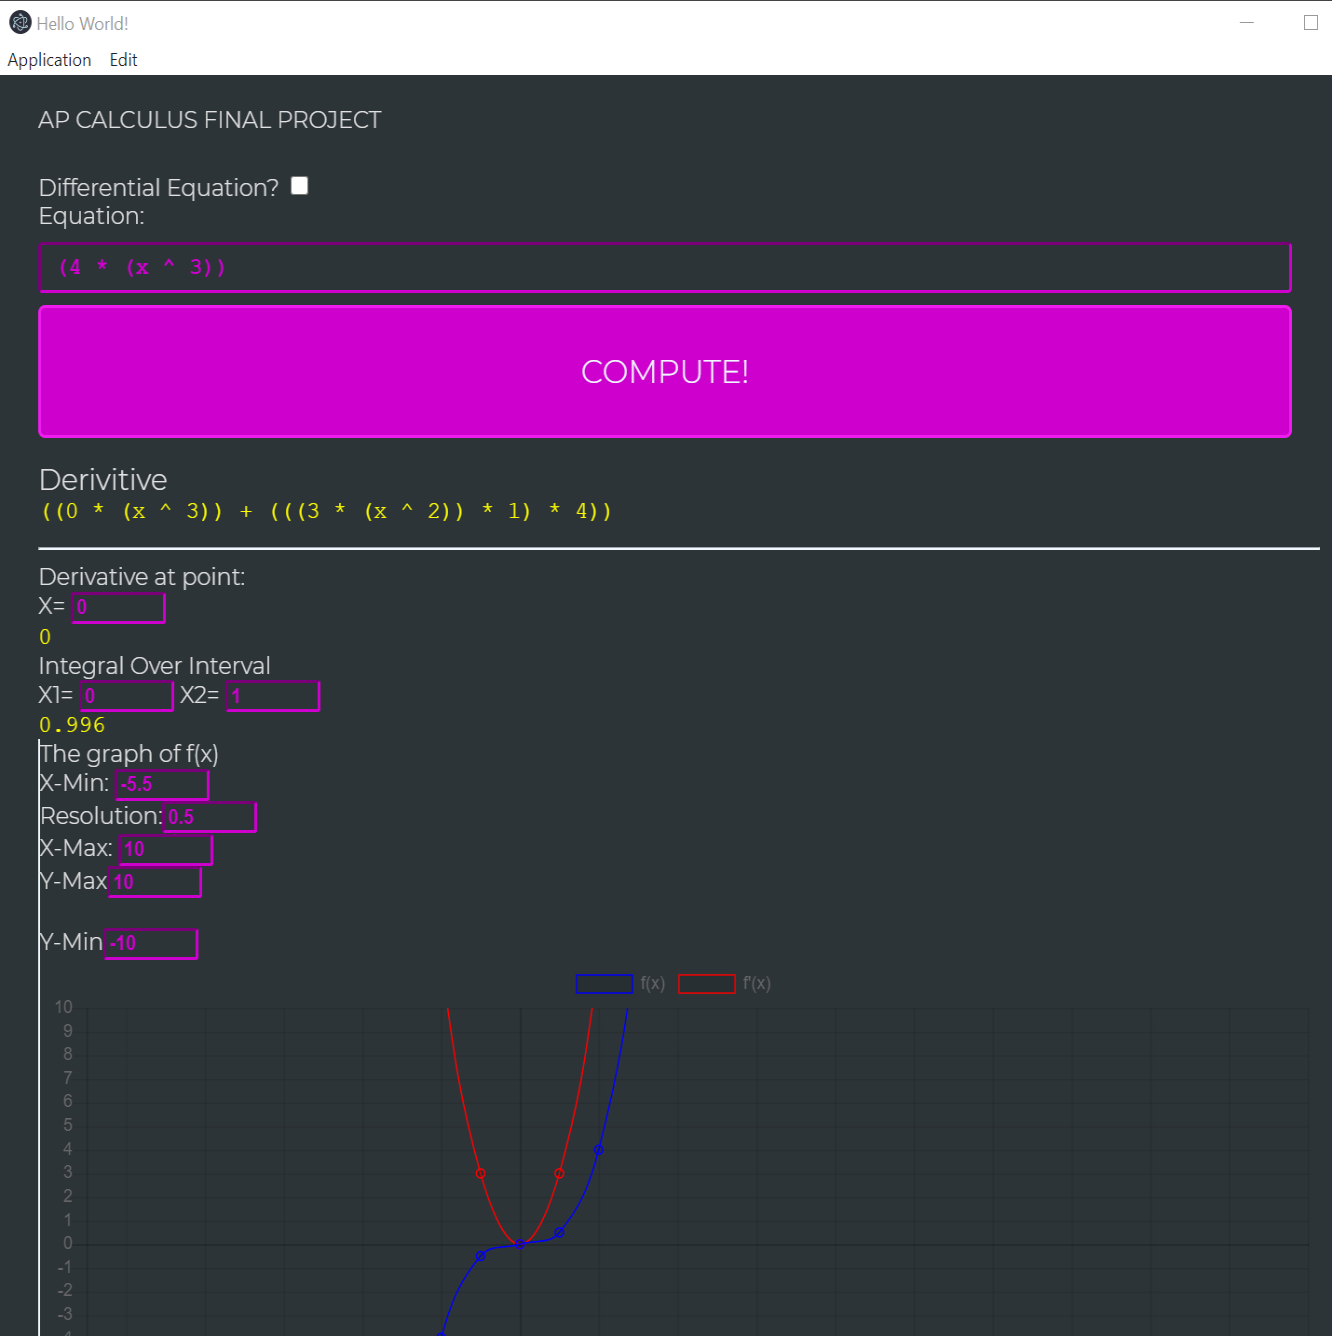
My final project for AP Calculus and AP CS Principles. For computation & visualization of Derivatives and Slope Feilds